Abstract

Introduction. Sickle cell disease (SCD) is characterized by a point mutation in the β-hemoglobin gene. Phenotypically and genetically, SCD is heterogeneous. Genetic variants have been identified that correlate with fetal hemoglobin (HbF) levels and some disease complications. Scores reflecting disease severity have been proposed to stratify patients by risk of complications and typically they include a combination of laboratory data and patient medical history. Except for the relationship of variants in HbF-modulating genes and α thalassemia with some aspects of disease severity, predicting patients at higher risk for complications using only genetic data has been difficult. Between a genetic variant and a physiologic outcome, or genotype and phenotype, are the proteins whose effects can be captured by laboratory measures. We propose a new approach to identify patients with various risks for common complications using hierarchical cluster analysis of standardized blood biomarkers coupled with a new method to identify statistically significant clusters.
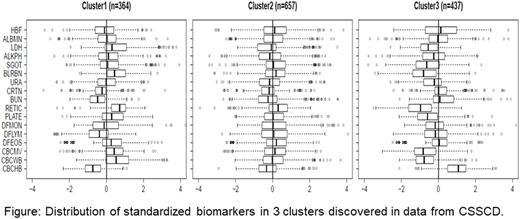
Methods and Results. We selected 17 uncorrelated blood biomarkers measured in 2,320 SCD patients with the common β-globin genotypes of this disorder from the Cooperative Study of Sickle Cell Disease (CSSCD). The biomarkers were selected based on significant correlation with age and sex and included 4 previously validated markers of hemolytic severity. We used hierarchical clustering to generate 17 clusters characterized by specific patterns of the biomarkers; the Figure shows an example. Eight of the 17 clusters included more than 40 patients, and we tested whether patients stratified in these 8 clusters differed in the distribution of β-globin genotypes, and risk of painful episodes, seizure, stroke, and mortality in longitudinally collected data. Compared with the largest cluster of 675 patients (Cluster 2) that is characterized by all 17 blood biomarkers following the average distribution, we identified a cluster of 437 patients (Cluster 3) with elevated HbF, hemoglobin, reduced bilirubin, LDH and other biomarkers who had reduced risk for stroke (hazard ratio HR=0.17, p=0.018) and mortality (HR=0.27, p=0.00045). Another cluster of 341 patients (Cluster 4) was characterized by elevated HbF, LDH and other markers of hemolysis and had reduced risk for number of seizures (OR=0.2, p=0.02) and pain severity (OR=0.59, p=0.00041). Cluster 3 was characterized by 47% HbSC disease patients and approximately 16% HbS homozygotes who, by their inclusion in this cluster, were likely to have milder disease. Cluster 4 was characterized by 79% HbS homozygotes and 18% HbS homozygotes with α thalassemia. Compared to patients in Cluster 2, patients with a signature represented by Cluster 3 had reduced hemolysis after 1 year and maintained a significantly higher HbF, while patients with a signature of Cluster 1 had increased hemolysis after 1 year and lower HbF.
For independent replication, we implemented a Bayesian classification rule to predict the cluster membership of patients enrolled in the PUSH and WalkPHASST studies of SCD using only the blood biomarker data. We had 16 of the 17 biomarkers (missing uric acid) measured at enrollment in the PUSH study and 13 of the 17 biomarkers (missing eosinophils, lymphocytes, monocytes, and uric acid) in the WalkPHASST study. Patients in the 2 studies grouped into clusters with profiles of biomarkers similar to those discovered in the CSSCD. The predicted clusters also had a similar distribution of SCD genotypes as in CSSCD.
Discussion and Conclusions. We identified a subset of patients with blood biomarker signatures associated with a better prognosis and hypothesize that the small number of HbS homozygotes with a positive prognosis characterized by reduced morbidity and mortality could carry rare protective variants. Identifying these variants could lead to the discovery of new therapeutic targets. These variants might be discovered in analysis of whole genome sequences available in the PUSH and WalkPHAAST study, and confirmed in CSSCD patients where GWAS data is available. Another advantage of this method is that commonly available laboratory data can be used to stratify patients by risk of complications in time for preventive therapy or for enrollment in clinical trials.
Gordeuk: Emmaus Life Sciences: Consultancy.
Author notes
Asterisk with author names denotes non-ASH members.

This icon denotes a clinically relevant abstract


This feature is available to Subscribers Only
Sign In or Create an Account Close Modal